• Skip to primary navigation
  • Skip to main content
Rethink Your Understanding

Rethink Your Understanding

Transforming Software Delivery

  • Home
  • Practices and Mission
  • Collaboration
  • AI
  • Posts
  • Podcast
  • Endorsements
  • Resources
  • Contact

Uncategorized

Engineering’s Business Value: From Black Box to Clarity

December 23, 2024 by philc

6 min read

This post is the first installment of my three-part series on connecting technology to business outcomes. In this foundational article, I delve into how organizations can redefine the value of software engineering by aligning technical efforts with measurable business results and customer impact.

Introduction

As a software engineer and technology leader with 25 years of experience spanning both waterfall and agile eras, I’ve heard the same refrain: “Technology is a cost center.” I’ve participated in reduction-in-force initiatives, stacked ranking exercises, and engineering team cuts—all driven by this persistent mindset. This experience has shaped my mission today: fundamentally changing how organizations view technology investments by directly linking our work to business and customer outcomes.

The Problem to Solve

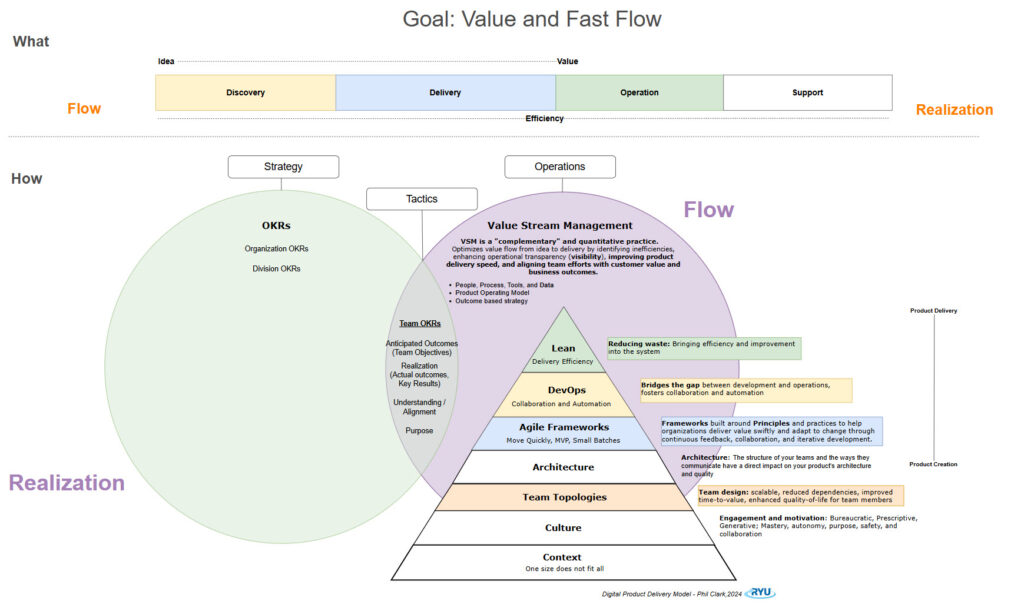
The fundamental challenge in technology leadership has remained constant through every era: how do we effectively link and communicate the ROI of our engineering investments? This challenge can be addressed as organizations shift to a product operating model and embrace Value Stream Management (VSM). These frameworks focus on aligning work with value streams that deliver measurable business and customer outcomes, ensuring that engineering efforts are tied directly to strategic priorities.

Technology roles, commanding some of the highest salaries in modern organizations, often become prime targets for cost reduction initiatives. The math seems simple on paper—reducing engineering headcount produces an immediate, significant impact on the bottom line. Yet calculating true costs and ROI becomes complex when team members are shared across multiple initiatives. Modern organizations are solving this through intentional team design: implementing stable, cross-functional teams with dedicated software engineers and selective sharing of specialized roles like Product Managers and Agile Leaders across a limited number of teams. By moving work to teams rather than moving people between teams, organizations can more accurately track costs, measure value delivery, and demonstrate ROI at the team and value stream or product level.

For many senior leaders, the world of digital products, systems, and software engineering can feel like an entirely foreign language—and for good reason. Despite its critical role, technology efficiency and performance are often treated as a “black box” within organizations. Meanwhile, departments like Marketing, Sales, and Product consistently align their efforts with measurable business outcomes.

This disconnect creates a significant gap in organizational insight and decision-making. Are we employing the right number of engineers within our budget? Are we simply hiring engineers without a clear plan for assigning work? By adopting smarter hiring and capacity management practices, we can minimize unnecessary overhead and avoid layoffs caused by poor resource planning. The key to closing this gap lies in establishing frameworks and improving visibility to clearly articulate the tangible value technology brings to the business. It all starts with defining clear, measurable outcomes.

Operational Efficiency, Realization, and Alignment

Until new solutions emerge, technology success stems from excelling in two core areas, seamlessly linked through strategic alignment.

  1. Flow: Operational efficiency in delivering value, from ideation to implementation
  2. Realization: Measurable business impact of technology initiatives

Well-structured OKRs bridge these areas by translating organizational strategy into team-level objectives, ensuring every technical effort connects directly to business outcomes.

Flow: Modern tools and practices have revolutionized measuring and improving performance. Agile methodologies, Team Topologies, DevOps strategies, value stream management, and advanced analytics now offer insights into operational workflows and delivery efficiency.  

Realization: Modern tracking and measurement tools empower teams to gather, organize, and analyze meaningful data, even when results take months or longer. The insights provided by these technologies “close the loop” by clearly connecting technical efforts to tangible business outcomes. Even when the results fall short of expectations, these insights empower teams to reflect, refine, or pivot their approach entirely.

Team alignment: Product Operating Model and OKRs

The shift to a product operating model is fundamental to linking engineering efforts to business outcomes. Organizations enable teams to own changes throughout the product lifecycle by aligning teams around products instead of projects. This ownership fosters expertise, accountability, and a long-term focus on delivering customer value. Unlike the traditional project-based approach, which often prioritizes short-term deliverables, the product model supports continuous improvement and meaningful outcomes over time.

OKRs are a powerful tool for bridging the gap between technology investments and business outcomes. When crafted effectively, OKRs should reflect your team’s primary responsibilities and stay within their span of control, ensuring alignment with the organization’s broader goals. This approach keeps everyone focused on the same mission while linking team efforts to delivering real customer value.

By creating a clear line of sight between your team’s work, customer value, and measurable business outcomes, OKRs provide a roadmap for demonstrating the tangible impact of technology investments. They turn abstract efforts into visible results, demystifying the role of engineering in driving success.

Start with Outcomes

Success in technology is often misunderstood. While delivering stories, releasing epics, or launching products signify progress, they fail to guarantee success. True success lies in whether the work delivered creates valuable outcomes. Even when outcomes fall short of expectations, success can be found in the insights gained—insights that help teams refine their approach and uncover overlooked factors. This shift in defining success is crucial for demonstrating technology’s business value.

Product managers are responsible for defining and measuring feature outcomes, while technical team members are accountable for articulating the anticipated results of addressing technical debt. This dual ownership ensures that both business features and technical investments are tied to measurable outcomes. When technical teams can link technical debt to specific business impacts, these investments transform from mysterious “maintenance work” into strategic initiatives with clear business value.

Alignment and Purpose

Starting with anticipated outcomes enables teams to develop meaningful OKRs that cascade from organizational strategy. By first defining the expected impact of their work, teams can craft team-level OKRs that naturally align with broader strategic objectives. This outcome-first approach ensures that every epic and initiative has a clearly defined, customer-centric goal and connects directly to the organization’s strategic direction. This approach prevents the common anti-pattern from creating OKRs, focusing solely on output rather than meaningful results.

By documenting both anticipated and actual outcomes at the epic level, teams can:

  • Track how their work contributes to business results over time
  • Make data-driven decisions about resource allocation
  • Better prioritize work based on expected impact
  • Build a straightforward narrative around technology investments
  • Bridge the communication gap between technical and business stakeholders
  • Leverage modern tools to provide visibility into both efficiency and impact
ROI for Engineering Teams

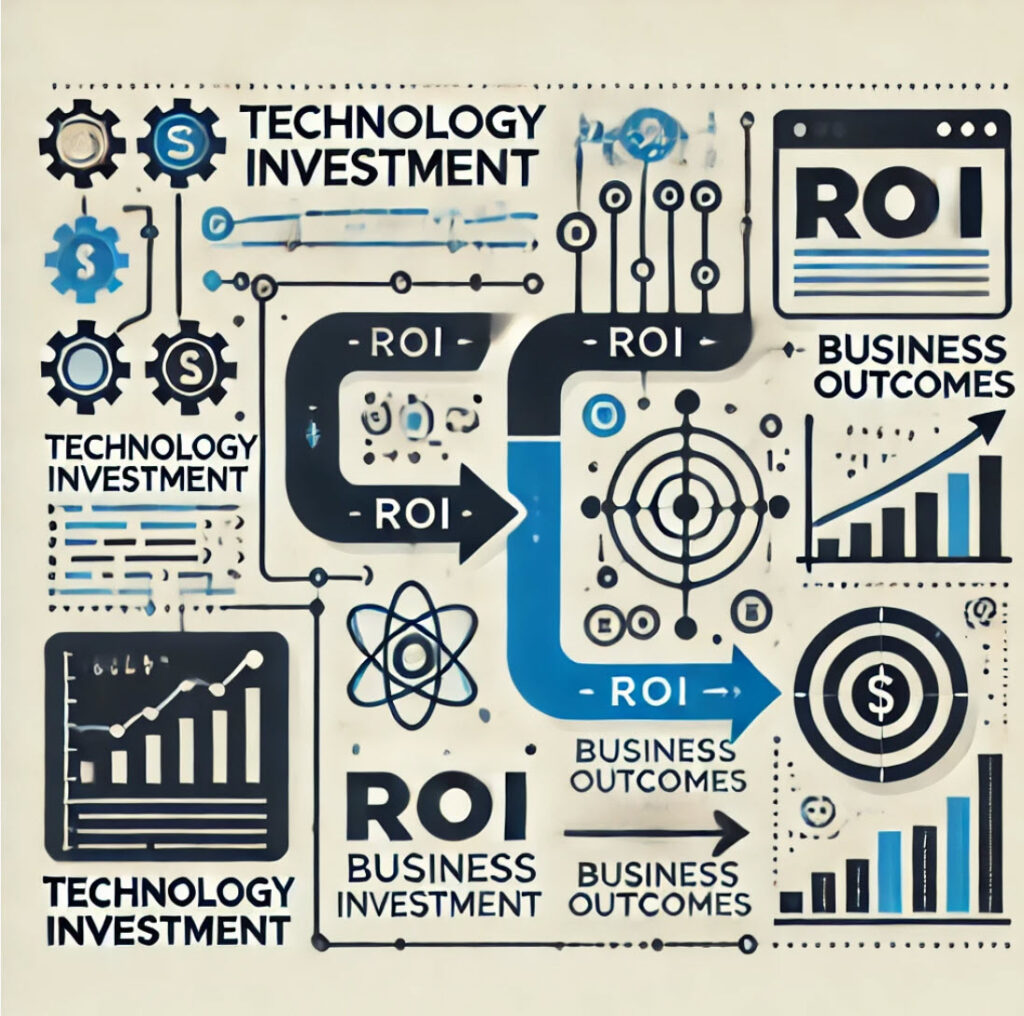
By evaluating the return on investment (ROI) of our cross-functional teams—comparing development costs with the financial benefits of improved features or business outcomes—we can make smarter decisions about resource allocation while showcasing the measurable impact of our engineering efforts.

Summary

It’s time to demystify technology’s role in business success. By adopting an outcome-based approach, defining actionable OKRs, and framing decisions regarding business value, we enable technology to drive growth. These practices don’t just justify investments—they link technology investments to business results and create a roadmap for long-term success.

This mission is personal to me: to reshape how organizations perceive technology—from a cost center to a catalyst for innovation, growth, and customer satisfaction. This transformation demands connecting technical decisions, code, and architectural choices to measurable outcomes. When we align technology with clear business and customer value, we not only bridge the gap between investment and impact—we close it entirely.

Next in the series

In the next article, I’ll share how a personal leadership epiphany can transform our engineering organization from a cost center into a strategic partner, with practical insights for driving business results. Read Now →

Poking Holes

I invite your perspective on my posts. What are your thoughts?.

Let’s talk: [email protected]

Filed Under: Agile, DevOps, Engineering, Leadership, Lean, Metrics, Product Delivery, Software Engineering, Uncategorized, Value Stream Management

Finally, Metrics That Help: Boosting Productivity Through Improved Team Experience, Flow, and Bottlenecks.

December 29, 2022 by philc

13 min read

Note: This article has two parts: First, a view on today’s data insights and metrics. Second, our experience researching the tools in the market.

Data is key to improvement, but it is not just about collecting and reporting it. We must use the right data for the right purpose to improve flow and efficiency, and team health. The way that leadership approaches the metrics ultimately still has the largest impact on success. We can unleash our full potential and reach our goals by adopting a metrics-driven improvement culture and methods that provide insights to encourage and motivate teams.” ~ Phil Clark

What is great software delivery?

To be excellent at delivering software, deliver the right changes efficiently, frequently, with quality, and get customer feedback. Move quickly with the confidence and knowledge that you are building the right things with quality and security. Innovate, Adapt, learn, and solve real customer problems faster than your competition.

What problem are we trying to solve?

Better ways of measuring software delivery performance.
How can we make the most optimal impact? We can assess software delivery team performance with useful metrics that both the organization and team members desire and those that encourage and enable teams to experiment and drive their own improvements. With a continuous improvement mindset, no matter how good we are today, we will get just a little better tomorrow.

Digital Product Workflow

Digital products flow across three primary stages: Product Discovery, Product Delivery, and Operations.

If you are performing value stream management, you create an end-to-end (concept to cash) cross-organizational flow of work for the value stream throughout the organization, understanding both upstream and downstream work and eliminating dependencies, waste, and friction.

End-to-end, Product Discovery, Product Delivery, and Product Operation: All stages of digital product management from idea generation to production or customer use, a.k.a concept to cash.

Product Discovery: The conceptual vetting stage of a digital product, from idea to backlog. Ideation, discussion, evaluation, and consideration for which features or products to prioritize and build to set the stage for increasing organizational performance.

Product Delivery: The delivery stage of a digital product, backlog to production.

Product Operation: The operation and support stage of a digital product.


Product discovery uncovers what creates value, while product delivery produces what creates value.

Measuring engineering performance

How are we doing? What are we doing well? What areas can we improve? What are we getting from our investment?

Measuring engineering performance has historically been a low point of my 20+ year technology career. During the first decade in technology, I was assessed solely as a practitioner by the metrics of that time. I vividly recall the metrics constantly reinforcing the notion of being perceived as a mere cog in a machine and the disheartening label of being a cost center.

As a manager, I was responsible for evaluating the performance of software engineers using the same criteria that I was assessed on as a practitioner. Based on these metrics, I would make decisions regarding individual team members, including stacked ranking. I have experienced the negative impacts on culture, engagement, and adverse side effects stemming from legacy metrics that treated people like machines (individual productivity measures, lines of code, and tracking hours).

Knowledge work is distinct from the repetitive workings of a mere machine.

Avoid measuring individual development activities in your business as it harms team dynamics and productivity; doing so will not help you reach your business goals, making it an ineffective use of time and resources. It is not just about the performance of individuals but all about successful teams. A shift to focusing on team outcomes and capabilities and measuring performance for continuously improving team flow is inspiring. Today’s delivery teams are seeking ways to maximize efficiency and streamline workflows. They can now access meaningful metrics to verify their efforts are paying off. By utilizing these revolutionary team metrics, teams can gain visible insights and signals to enhance their product development and delivery process further.

Whether Flow- or DORA-based, today’s metrics should combine system/process data (quantitative) and self-reported data (qualitative).

We are not the teams of yesterday

Significant influences have shifted how we can instrument and measure engineering performance (IT, digital product delivery) from the past. 

The team’s design has changed: shifting from large, skill-based functional silos that hand off work to the next functional team to small, cross-functional teams that can deliver solutions with the least dependency on other teams.

Capabilities have changed: architecture (microservices, DDD, event-driven, lambda, serverless computing, and more), culture, team design, continuous integration, continuous delivery, cloud strategies, automation, quality practices, SDLC (agile, lean), DevOps, platform engineering, and more.

Systems measures have changed (quantitative): It provides visibility to change the system rather than focusing on the individual people.

Dora Metrics (Product Delivery: Development to Production)

  • History of DORA, acquired by Google Cloud in 2018.
  • Accelerate State of DevOps Report
  • Accelerate: The Science of Lean Software and DevOps by Nicole Forsgren PhD, Jez Humble, Gene Kim
  • Platforms: There are several solution providers in the DORA space (delivery), such as LinearB

Flow Metrics (Product Discovery and Product Delivery: Idea to Production)

  • Project to Product by Mik Kersten
  • Lean practices and Value Stream Management (VSM) and Flow metrics
  • Platforms: There are several options in the VSM and Flow space, such as Planview Tasktop Viz

Self-reported data around team health and sentiment metrics have improved (it can be both qualitative and quantitative).

People aren’t happy because they’re successful; they’re successful because they’re happy. Happiness is a predictive measure. 1

  • Developer Experience (DX); I recommend and focus on Team Experience (TX)
  • SPACE, a New Framework to Understand and Measure Developer Productivity
  • Platforms: DX (getdx) plus one that focuses on team experience (TX) like TeamRetro or agilityhealth. Most likely, several more in the market should be mentioned here. 

Note: I have no equitable affiliation or endorsement benefits from any of my recommendations

Separate the business from the team conversation

Separating business pressure to drive metrics from a team’s motivation to use metrics for improvement is crucial. Teams that focus on continuous improvement and have visibility into metrics can identify and solve bottlenecks, leading to better outcomes and aligned results with business expectations. Metrics can be imposed by the business, risking gamification, or embraced as tools for team improvement.

Teams need motivating metrics. When teams manage improvement insights, they view the metrics as feedback to provide visibility into areas where they are performing well or where they can improve. They mine for bottlenecks and improve overall flow and outcomes. Despite their imperfections, metrics like these help to evaluate the outcomes that teams produce rather than just focusing on the numbers or outputs of individual contributors. Through monthly reviews, the teams can collaborate and develop ways or experiments to improve the bottlenecks.

How might metrics be viewed differently between the business and the delivery teams?

Business interest (focus in on the numbers): 

  • Are team metrics, the numbers, improving?
  • How can we predict the delivery estimates of a team?
  • Are department metrics improving (aggregate of all teams or portfolios)?
  • What actions are teams taking to improve?
  • Capacity, development cost per product, and return on investment.

Benefits:

  • Team throughput and delivery insights.
  • Time to market.
  • Improved predictability.
  • Delivery performance is an artifact of organization valuation. Over time, this creates a higher-quality system with fewer problems.

Risks: 

  • Pressure for individual metrics. Developers are more than just coders. Overemphasizing individual developer focus can be detrimental to team culture and overall performance. It is the collective effort of teams that delivers software, not the work of individual developers.
  • Organization leaders with a heavy hand push on the numbers. Teams use gamification to drive numbers, please the business for what their company wants to see, and risk limited or no real improvements to throughput.
    • If you still fear team gamification and misuse of metrics that defeat the value of modern ways to measure and motivate efficiency improvement, consider improving your leadership before blaming the tools or teams.
  • Comparing teams, pitting them against one another and the behaviors that arise from this, and knowledge hoarding. Each team’s work is most likely different than other teams’ work, making it difficult to compare.
  • Retention.

Teams view (focus on bottlenecks and conversations):

  • How are we doing? Where and how can we move the needle to improve throughput flow?
  • What areas are we doing well? Why might this be?
  • What are our bottlenecks to flow (what steps in our workflow take the longest time)?
  • What are the current obstacles we face regarding lead time, cycle time, PR time, and failure rate?
  • Where can we reduce waste? Can automation help?
  • What capabilities or practices can we change or add to help us?
  • What types of work need to receive the proper attention?
  • More experienced teams: How do we compare to similar cohorts or cohort clusters in the industry (if this data is available)?

Benefits:

  • Teams have the data insights to highlight underlying bottlenecks.
  • Improved time spent in active states versus wait states.
  • Collaboration and knowledge sharing across teams.
  • Autonomy, teams have meaningful metrics to allow them to solve efficiency problems (address the bottlenecks).
  • Teams use qualitative feedback (sentiment metrics) to encourage conversation, improve collaboration, and reduce toil and friction.
  • Team member engagement and employee retention.

Risks:

  • Focusing on individual team member performance. It has been my experience that small teams will not tolerate underperforming team members over time; if the team can’t solve the concern, they can surface the issue to the individual’s manager. I like using the analogy of a music band. The other band members will recognize an underperforming band member.

Leaders must avoid the outdated mindset of individual metrics, measuring individual productivity and lines of code and having teams compete against one another (comparing teams by metrics). Instead, leaders should focus on metrics that improve team flow and delivery efficiency. These metrics should combine system/process data (quantitative) and self-reported data (qualitative).

“When teams recognize the value of today’s metrics and utilize them to enhance their delivery flow, focusing on the bottlenecks and friction points, the business numbers will naturally follow suit. By embracing this approach, improvements become inherent, allowing the numbers to care for themselves.”

Qualitative Metrics: Developer Experience (DX) versus Team Experience (TX)

Prioritizing workplace happiness is crucial for success as it can lead to improved productivity, innovation, and revenue. It surpasses traditional metrics and should not be considered a perk but a key driver of a more profitable workplace.

Developer experience (DX) has been a hot topic in the technology industry lately. Most organizations build software as teams; I speak for cross-functional teams that consist of developers and other roles necessary to deliver software. Developers construct the code, but the whole team must provide the solution.  I recommend ongoing survey questions for self-reported qualitative metrics centered on developer and team feedback (TX). Earlier in this post, I shared the names of a couple of solution providers.

Team experience (TX) includes day-to-day work delivering work on teams. It encompasses all the different points of friction team members encounter in their work, including the organization’s tools, processes, and culture. Improving TX is critical to the business’s bottom line, as research shows it is a top predictor of engagement, productivity, and satisfaction. Companies with top-quartile team experience outperform their competition regarding productivity and their ability to innovate faster.

Summary on metrics

Effective teams want to improve. By offering teams a clear strategy, including an illustrative map (like a value stream or flow map), and specific expectations of outcomes, they can be afforded autonomy. They will be free to make their own decisions. Additionally, by providing them with team-based metrics that spotlight any bottlenecks in their process, the team members can confidently decide how best to positively improve the overall efficiency and effectiveness of their role in the workflow.

The business still needs to see results. Assuming team autonomy and motivating team metrics, as a business leader, you can step away from the teams and leave them alone to do their best work. You identify leaders to support the team to focus on outcomes and performance. You can focus on aggregating the signals of the metrics that matter to you. There is no “one” metric to gauge efficiency. Combining the feedback from multiple signals before raising concerns would be best. This approach means you don’t have to interrupt people or teams to get them to justify their numbers unless you have concerns. Suppose the data over a more extended period raises concerns. In that case, you can gain an understanding from the team of what might be happening and provide any guidance or action that may help them get back on track, if necessary.

A fresh perspective on performance measurement is emerging in the industry. These metrics focus on optimizing flow across the organization and should provide system and process level data (quantitative data) combined with self-reported health metrics data (qualitative data) to remove negative impacts on team culture. This improves engagement and puts improvement decisions at a team level. With this approach, the entire organization should see gains in optimizing the flow of work and improving delivery outcomes.

Removing the pressure of the business’s view on the team’s metrics is essential to foster confidence and trust that the team can review and act on insights, allowing them to identify areas where they can improve how they deliver software. To better insights and increase team engagement, using system-measurable metrics and regular, consistent surveys capturing teams’ experiences (sentiment) is essential. These visible metrics empower the teams to review and experiment with improvements.


Researching the market

The challenge

As a department leader, I am responsible for equipping our product development and delivery teams with performance feedback and metrics that will provide them with insights they can use to continue improving, even if they are already performing at a high level.

My team and I recently evaluated Value Stream Management (VSM), Flow, and DORA metrics platforms to assess the depth of data visibility into the product discovery and delivery phases and workflows through dashboards. The current market at the time of my writing provides many solution providers boasting different features, focuses, and prices, so it’s essential to do your due diligence before choosing one that fits your organization’s needs best.

Most solution providers focusing on VSM and Flow Metrics serve mid-market and enterprise organizations. In contrast, the solution providers focusing on DORA metrics serve small and medium businesses (SMB) and mid-market organizations. This evaluation experience was rewarding; it generated great conversations with solution providers and within my team and inspired this post.

Selecting a provider and partner

Selecting a metrics tool provider requires thoroughly understanding your organization’s needs, goals, and budget. Although we recommend a solution that covers all stages of the value stream, these options are targeted at enterprise-level budgets. They may not be affordable for SMB and mid-market organizations.

After evaluating the market, we identified two primary categories of metrics tool providers. The first category provides a comprehensive view of the entire value stream and can ingest data from various sources. In contrast, the second focuses on development and delivery, with optics around or extensions of the DORA metrics. We found that VSM metrics platforms tend to target enterprise budgets, while DORA metrics platforms are more affordable for SMBs and mid-market organizations.

We prefer a think big, start small, scale-out approach for most change efforts, as we did with our agile and DevOps transformation and our decision to select a VSM metrics solution provider. If development and delivery are your most significant bottlenecks, start with DORA and local metrics. Otherwise, you can expand to other parts of the delivery planning or discovery optics from value stream management solutions to gain operational efficiencies.

In my selection research, I found that some vendors measure performance and efficiency across the entire flow, while others focus only on one stage, measuring product delivery. However, I did not find one solution that measured both stages well. Additionally, I needed help finding a solution that provided strong team health metrics and qualitative data around human dynamics and team operations, in addition to system measures.

Another critical difference I discovered between service providers was the degree of data integrations or data read access available. While all platforms offer visualizations to identify bottlenecks, some providers do not integrate with systems of record that provide deeper insights into stages and the tasks causing the bottlenecks. When evaluating a solution, consider whether additional metrics are necessary to narrow the bottleneck or which components need to change to improve the bottleneck.

Visualizing the instrumentation options

I created the following diagram to help me convey these concepts when having this conversation with others:

Final thoughts

I am encouraged by the digital product delivery metrics available today that focus on teams’ usage to make decisions to improve performance and efficiency. Two measurements are necessary for teams to have the information they need to succeed: system process performance data and human dynamics, sentiment, and how teams operate.

While some solution providers have been in the market for some time, it was apparent that this market is still relatively young and proliferating with new vendors and improved features from competitors. Your approach to metrics and the degree to which you can visualize data in one solution can be the difference for your team. There are drastic differences in prices and capabilities among these solutions. I suggest you examine how you present flow and optimization across the organization. Select a solution that best fits the context of your teams and organization.

Another exciting aspect: Linking data to business value outcomes and impact (closing the loop). We can quantify the impact of our investments in agile, lean, and DevOps software delivery best practices.

Poking Holes

I invite your perspective to analyze this post further – whether by invalidating specific points or affirming others. What are your thoughts?.

Let’s talk: phil.clark@rethinkyourunderstanding.


Related Posts

  • The Artistry of Software Engineering: Harnessing Creativity for Impactful Business Solutions. September 17, 2022 by philc

References

  1. Sutherland, Jeff; Sutherland, J.J.. Scrum (p. 148). Crown. Kindle Edition

Filed Under: Agile, Delivering Value, DevOps, Engineering, Leadership, Lean, Metrics, Product Delivery, Uncategorized

Copyright © 2025 · Rethink Your Understanding

  • Home
  • Practices and Mission
  • Collaboration
  • AI
  • Posts
  • Podcast
  • Endorsements
  • Resources
  • Contact